Fast Dry Cleaner Remediation
Case Study Demonstrates Fast Dry Cleaner Remediation
Bioaugmentation makes fast and cost-effective dry cleaner remediation possible. Dry cleaning solvents were found in the ground water adjacent to a dry cleaning facility located in a commercial shopping center in Houston, Texas. InControl Technologies, Inc. of Houston, Texas was the environmental consulting firm that completed the site investigation and remediation.
CL-Out® bioremediation was implemented to reduce the mass of contamination in the source area. CL-Out® is a consortium of Pseudomonas sp. that produces constitutive enzymes to cometabolize PCE and other halogenated aromatic compounds. Dextrose is added with CL-Out® to provide a substrate for microbial growth. Application of CL-Out® bioremediation at this site achieved the cleanup goals in less than 6 months. The cleanup goals were maintained for more than one year to achieve project closure.
Geology and Hydrogeology
The site is located on a coastal plain where the geology is characteristically interbedded silt and sand deposits overlying a thick cohesive clay formation. The affected aquifer was a silty sand zone approximately 40 to 55 feet below grade. The aquifer ground water yield was low and the ground water was classified as Class 3 ground water.
The ground water aquifer was naturally aerobic. Dissolved oxygen measurements taken from monitoring wells in the source area ranged from 2.6 to 5.4 mg/L. The oxidation-reduction potential (ORP) measured in the same wells ranged from 89 to 303 mveq. The aerobic conditions of the aquifer favored aerobic CL-Out® cometabolism.
Contamination
Monitoring wells were installed on all sides of the dry cleaners, but access restrictions prevented the installation of monitoring wells inside the building. The site layout including sampling and treatment locations are shown on the attached figure. PCE and concentrations of daughter products, including TCE and cis-1,2 DCE were found in ground water adjacent to the dry cleaners and down gradient businesses. PCE concentrations in the source area ranged from 0.260 mg/L to 0.860 mg/L prior to remediation. The TCE concentrations ranged from 0.031 mg/L to 0.085 mg/L. The cis-1,2 DCE concentrations ranged from 0.096 mg/L to 0.67 mg/L. Vinyl chloride was not detected prior to remediation. The sampling results are summarized in the attached table. The contamination plume was estimated to be 7,500 square feet.
While the presence of breakdown products suggested natural attenuation by biological destruction was occurring, bioaugmentation was implemented to accelerate the site remediation.
Remediation Design
CL-Out bioremediation was implemented in the ground water in the source area and accessible down gradient locations. Most of the down gradient plume, however, was inaccessible for direct treatment. Due to limited access, the down gradient areas were treated by attenuation as the source mass was destroyed up gradient. Eight temporary injection wells were installed around the dry cleaner building and source area. The injection points were set with 10-foot-long screened intervals from 40 to 55 feet deep. The temporary injection wells allowed for repeat inoculations without additional drilling costs.
CL-Out® organisms were injected into the affected aquifer in two events. On April 15 and June 30, 2005, 50 gallons of hydrated CL-Out® were injected into the temporary injection wells. Approximately 10 gallons of CL-Out® solution was gravity fed into each injection well without additional pressure.
Monitoring Results
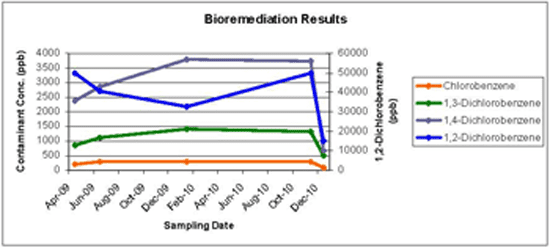
Ground water samples were taken from the monitoring wells for laboratory analysis for the contaminants and field measurements of dissolved oxygen and ORP. The field parameters show that after application of CL-Out® bioaugmentation the dissolved oxygen levels and ORP decreased. This decrease confirms aerobic metabolism was taking place. The PCE and TCE concentrations also decreased immediately following the injections. However, there was also an increase in the cis-1,2 DCE concentrations following the bioaugmentation. The cis-1,2 DCE concentrations decreased to the pretreatment levels in each of the source area wells except MW-4 during the post treatment monitoring. Vinyl chloride was detected in MW-1 and occasionally in MW-8 and MW-11 after bioaugmentation, but persisted in only MW-1. Maintaining aerobic conditions would have reduced or prevented the accumulation of the daughter products. Nevertheless, the daughter product concentrations did not exceed the Class 3 Standards applicable to the site.
The following tables show the PCE concentration trends during remediation. MW-2, shows the concentration of PCE in a well outside of the treatment area remained relatively constant during the same time.
Ground Water Sampling Results Summary Table
| Monitoring | Date | PCE | TCE | cis-1,2 DCE | VC | D.O. | ORP |
| Well | (mg/L) | (mg/L) | (mg/L) | (mg/L) | (mg/L) | (mveq) | |
| GW Class 3 PCL | 0.5 | 0.5 | 7 | 0.2 | |||
| MW-1
|
3/24/04 | 0.800 | 0.090 | 0.500 | <0.001 | 5.8 | 131.7 |
| 8/13/04 | 0.700 | 0.100 | 0.510 | <0.001 | 5.8 | 134.3 | |
| 11/23/04 | 0.660 | 0.045 | 0.550 | <0.005 | 5.4 | 154.6 | |
| 3/30/05 | 0.750 | 0.067 | 0.550 | <0.001 | 5.0 | 303.5 | |
| First CL-Out Inoculation | |||||||
| 6/2/05 | 0.230 | 0.045 | 1.100 | <0.001 | 0.9 | -131.1 | |
| Second CL-Out Inoculation | |||||||
| 9/19/05 | 0.065 | 0.044 | 0.900 | 0.0032 | 3.0 | -105.4 | |
| 12/29/05 | 0.016 | 0.0084 | 0.650 | 0.021 | 3.0 | -30.8 | |
| 3/17/06 | 0.0054 | 0.0021 J | 0.600 | 0.030 | 0.9 | -104.7 | |
| 6/8/06 | 0.018 | 0.018 | 0.120 | 0.039 | 1.2 | -107.7 | |
| MW-4
|
3/23/04 | 0.540 | 0.036 | 0.110 | <0.001 | 4.9 | 128.1 |
| 8/13/04 | 0.760 | 0.039 | 0.140 | <0.001 | 5.0 | 128.0 | |
| 11/23/04 | 0.530 | 0.026 | 0.130 | <0.005 | 5.2 | 141.2 | |
| 3/30/05 | 0.410 | 0.019 | 0.096 | <0.001 | 5.1 | 220.3 | |
| First CL-Out Inoculation | |||||||
| 6/2/05 | 0.330 | 0.019 | 0.120 | <0.001 | 4.2 | -79.3 | |
| Second CL-Out Inoculation | |||||||
| 9/19/05 | 0.390 | 0.028 | 0.140 | <0.0003 | 3.4 | -81.8 | |
| 12/29/05 | 0.410 | 0.031 | 0.200 | <0.001 | 2.8 | -20.8 | |
| 3/17/06 | 0.089 | 0.021 | 0.410 | <0.0003 | 0.6 | -102.6 | |
| 6/8/06 | 0.250 | 0.032 | 0.300 | <0.00017 | 1.1 | -103.2 | |
| MW-8
|
8/23/04 | 0.580 | 0.046 | 0.220 | <0.001 | 3.1 | 88.7 |
| 11/23/04 | 0.260 | 0.028 | 0.280 | <0.001 | 4.7 | 157.8 | |
| 3/30/05 | 0.700 | 0.039 | 0.330 | <0.001 | 3.7 | 287.0 | |
| First CL-Out Inoculation | |||||||
| 6/2/05 | 0.150 | 0.031 | 0.250 | <0.001 | 3.0 | 95.9 | |
| Second CL-Out Inoculation | |||||||
| 9/19/05 | 0.045 | 0.0095 | 0.920 | 0.00051 J | 4.2 | 24.1 | |
| 12/29/05 | 0.011 | 0.0013 | 0.420 | 0.0027 | 3.3 | 33.6 | |
| 3/17/06 | 0.0045 J | <0.0023 | <0.0029 | <0.003 | 1.1 | 34.4 | |
| 6/8/06 | 0.0024 J | <0.00025 | 0.300 | 0.0024 J | 1.0 | -106.3 | |
| MW-11
|
8/13/04 | 0.580 | 0.085 | 0.420 | <0.001 | 2.8 | 129.1 |
| 11/23/04 | 0.580 | <0.2 | 0.480 | <0.2 | 3.3 | 150.5 | |
| 3/30/05 | 0.860 | 0.074 | 0.670 | <0.001 | 2.6 | 278.3 | |
| First CL-Out Inoculation | |||||||
| 6/2/05 | 0.270 | 0.031 | 0.490 | <0.001 | 2.8 | 161.3 | |
| Second CL-Out Inoculation | |||||||
| 9/19/05 | 0.180 | 0.023 | 0.720 | 0.00081 J | 3.5 | 77.9 | |
| 12/29/05 | 0.096 | 0.0083 | 0.120 | 0.0017 | 2.9 | 61.9 | |
| 3/17/06 | 0.046 | 0.0062 J | 0.057 | <0.003 | 1.5 | 108.2 | |
| 6/8/06 | 0.056 | 0.007 | 0.470 | 0.0039 J | 0.9 | 62.2 | |
After one year, the contaminant concentrations continued to meet the cleanup goals in the source area and a Certificate of Completion was recommended for the project. The total CL-Out® remediation cost was less than $10,000.